Dashboard Overview
The Dashboard provides a summarized view of the portal’s key metrics and visual insights into recent activity.Summary Cards
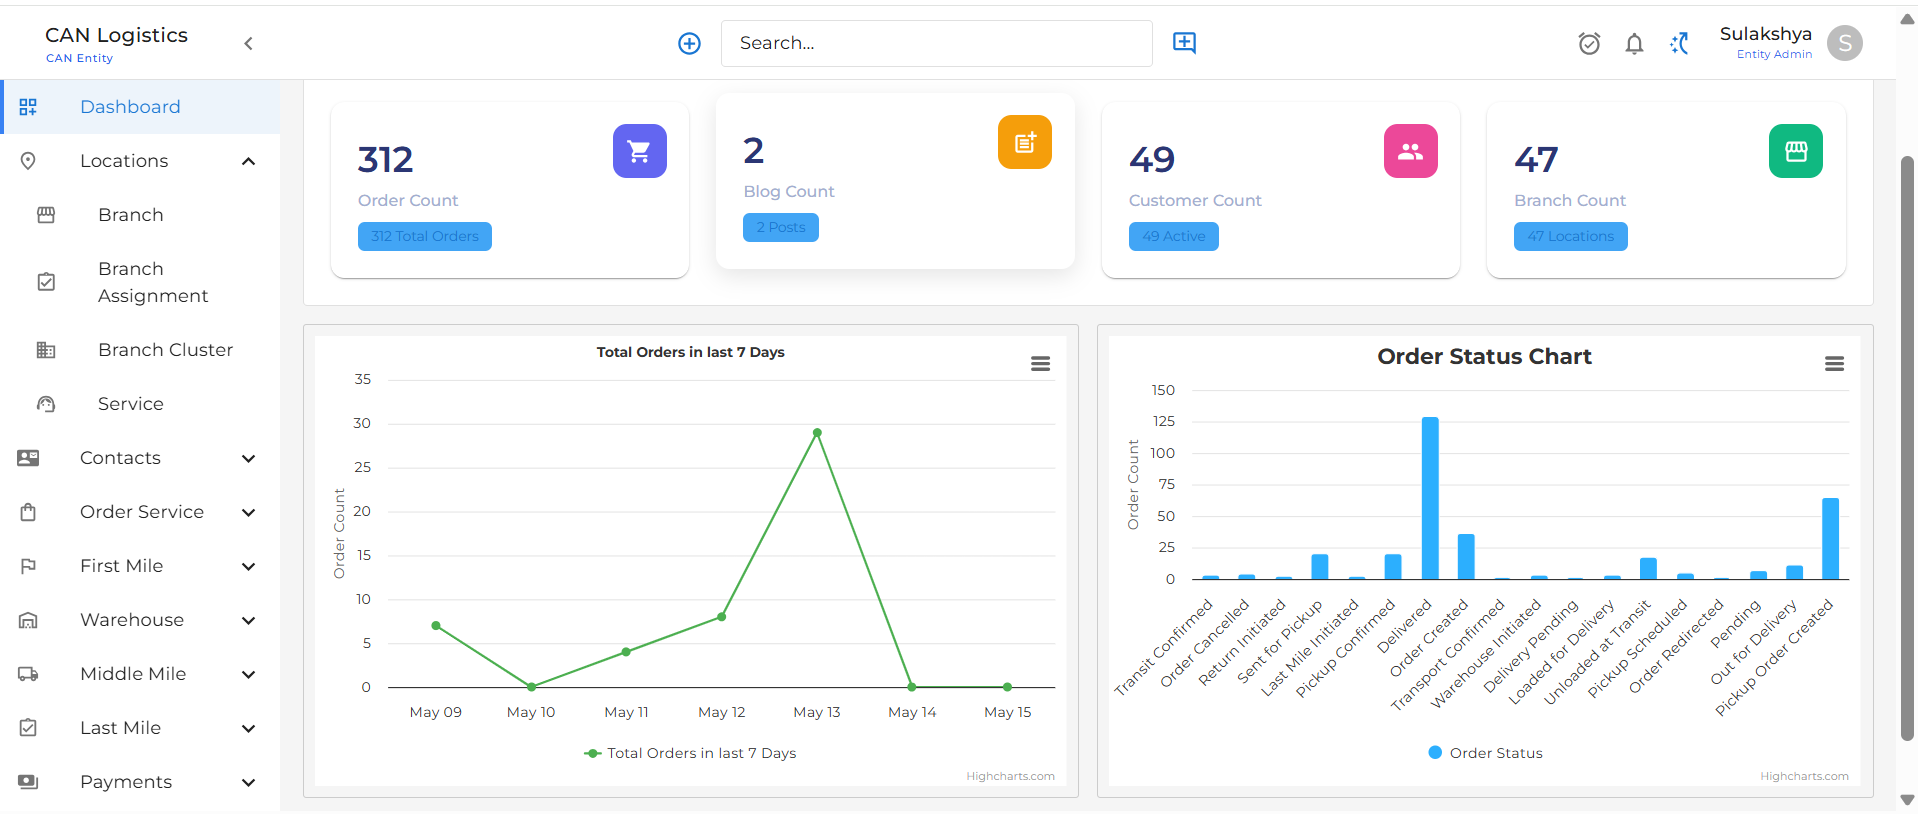
At the top of the dashboard, key statistics are displayed as summary cards:- Total Orders: Displays the total number of orders created in the system.
- Total Blogs: Displays the total number of published blog posts.
- Total Customers: Shows the number of registered customers.
- Total Branches: Displays the count of active branches available in the system.
Order Activity (Last 7 Days)
A line or bar graph displays the number of orders placed in the last 7 days.Features:
- X-Axis: Represents the date for each of the last 7 days.
- Y-Axis: Number of orders placed on each respective day.
- Purpose: Helps understand daily order trends.